
For April’s edition of the WPM, we focused specifically on whether a hotel’s price position relative to its local market average reflects different pricing strategies.
- The lose rate increases when a hotel’s price is above the market average.
- This effect is more pronounced in independent hotels, which are also more exposed to price aggressiveness from non-major OTAs when their prices exceed the market average.
- The average direct price from January to April 2025 was 6.3% higher than in the same period of 2024.
- Direct prices increased steadily from January to April 2025, mirroring the pattern seen in 2024.
1. BML Average
April’s BML reached 35%, representing a 5-point increase compared to March, as shown in Graph 1:
Graph 1. Average | April 2025 | Beat, Meet, and Lose

Source: World Parity Report | April 2025
When comparing the hotel’s direct rate to the best available OTA offer, we see that in 75% of cases at least one OTA displays a lower price than the hotel’s own website.
2. Most Aggressive OTAs
Regarding OTA pricing strategies, the major groups — Booking and Expedia — continue to apply less aggressive pricing tactics compared to other intermediaries (see Graph 2).
That said, Expedia breaks from its earlier trend and surpasses a 20% lose rate again this month.
Graph 2. OTAs and Metasearch Engines with the Most Aggressive Pricing | BML | April 2025
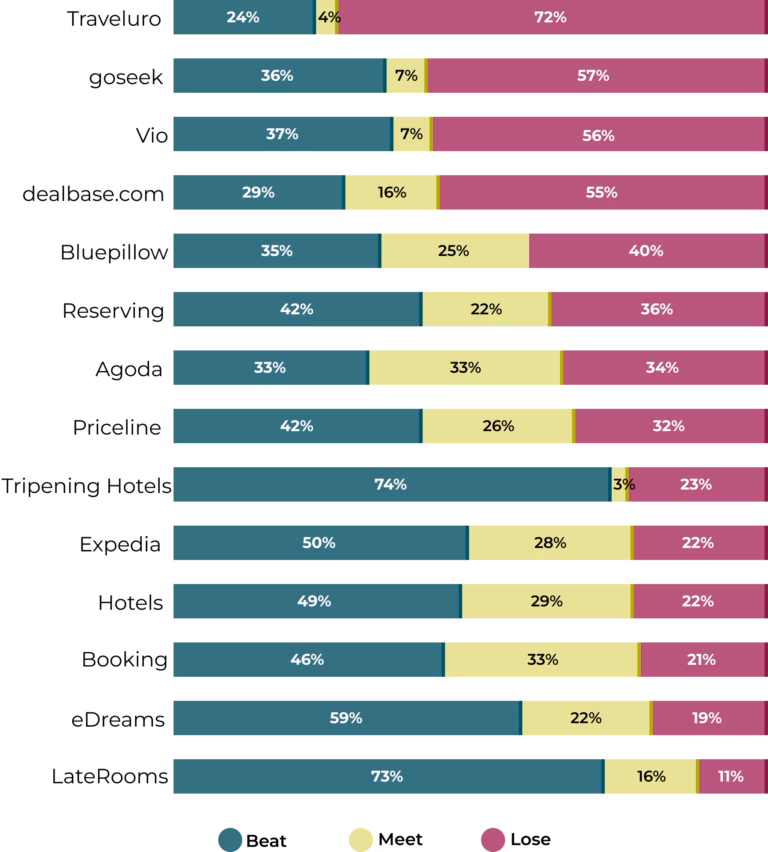
Source: World Parity Report | April 2025
3. Changes in Pricing Strategy Based on Market Price Levels
Overall, the lose rate increases as the hotel’s price rises above the local market average (Graph 3).
Graph 3. BML by Price Segment: Major vs. Other OTAs
Source: World Parity Report | April 2025
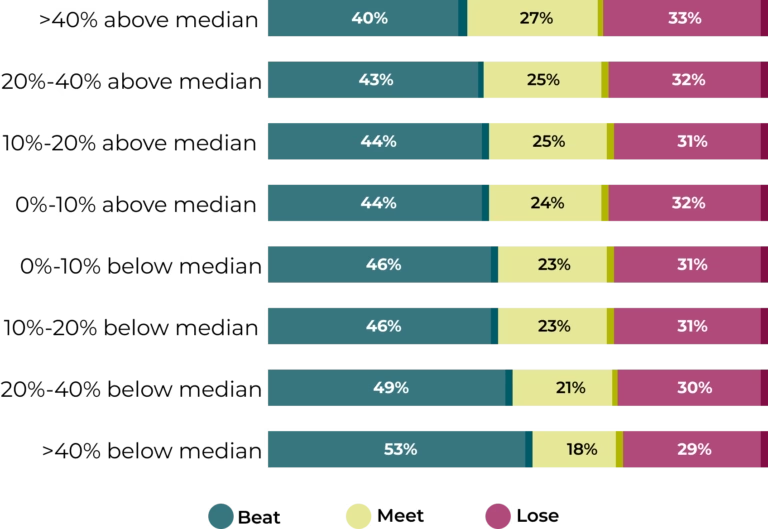
4. Who Becomes More Aggressive at Higher Price Levels?
Major OTAs do not significantly increase their price aggressiveness when the hotel’s rate is above the market average — their lose rate remains relatively stable across all price segments.
In contrast, the direct channel becomes more competitive in lower-price segments (with higher beat rates when hotel prices are below the market average), while meet rates increase in higher-price segments (Graph 4).
Graph 4. BML by Price Segment: Major OTAs
Source: World Parity Report | April 2025
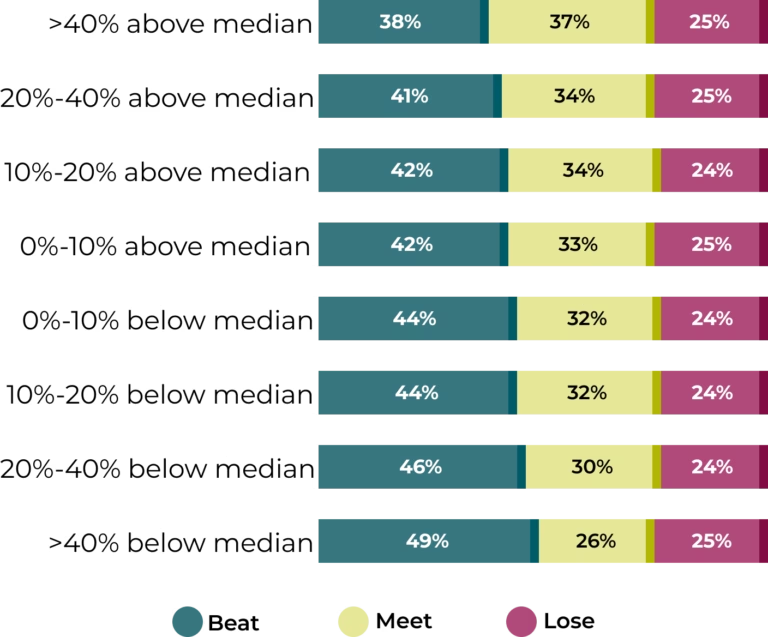
Non-major OTAs, however, show a different pattern: their lose rate increases notably when hotel prices exceed the market average (Graph 5).
Graph 5. BML by Price Segment: Other OTAs

Source: World Parity Report | April 2025
5. Which Hotel Types Are Most Affected? BML by Price and Hotel Type
When segmented by hotel type, the most aggressive behaviors are observed in independent hotels, particularly when compared with non-major OTAs.
When prices are more than 40% above the market average, the lose rate reaches 41.8% in the case of these OTAs, compared to 34.0% for major OTAs (Graph 6).
Graph 6. BML in Independent Hotels by Price Segment: Other OTAs

Source: World Parity Report | April 2025
Independent hotels or those in smaller chains face greater OTA price pressure when their rates are positioned above the average for their market.
This increased aggressiveness is especially apparent among smaller OTAs, underscoring the need for closer monitoring of these intermediaries, as price disparity tends to intensify in high-price contexts.
In this context, industry experts weigh in: “Higher-priced hotels often experience more rate parity issues, particularly from tertiary OTAs undercutting them. This is likely due to the complexity of their distribution networks,” explains Joe Pettigrew, Chief Commercial Officer (CCO) at L+R Hotels. “These hotels—typically luxury properties or those in major urban markets—serve diverse, international guest segments and still rely heavily on B2B channels. The broader and more fragmented the distribution, the harder it becomes to maintain rate integrity. With many intermediaries accessing rates, it becomes increasingly challenging to minimise undercutting (lose score) and optimise direct performance (beat score), compared to hotels working with a more limited and controlled set of partners.”
6. Price Evolution Analysis
To wrap up this “deep dive into pricing analysis”, here are a few insights into price trends (see Graph 7).
Graph 7. Price Evolution (euros): Q1 2024 vs. Q1 2025

Source: World Parity Report | April 2025
Base 100 = Direct Price January 2024
Although the report includes destinations with varied seasonality, most of the 60 analyzed locations follow a northern hemisphere pattern.
This is reflected in the upward monthly price curve, also influenced by the calendar (Easter fell in March in 2024 and in April in 2025).
The same pattern repeats in the first quarter of 2025: prices rise progressively from January through April. This suggests a structural trend — direct prices start low at the beginning of the year, rise steadily in spring, and tend to decline toward the end of the fiscal year.
In aggregate terms, direct prices in Q1 2025 were 6.3% higher than in Q1 2024. In other words, the year began with a higher average nightly rate, possibly reflecting sustained demand growth.