
Evolution of Price Parity in the Global Hotel Sector in January 2025
123compare.me has published the results for January 2025 from its monthly report on the evolution of price parity in the global hotel sector, the World Parity Monitor.
The general objective of the World Parity Monitor is to determine the state of Price Parity across different OTAs compared to the official price of 3-, 4-, and 5-star hotels.
The collected data shows behavioral patterns very similar to the trends observed in 2024 regarding price parity: booking anticipation, length of stay, and the type of distribution channel continue to be key factors in understanding the pricing strategies deployed by online intermediaries.
Highlights January 2025: Evolution of Price Parity in the Global Hotel Sector
- The major OTAs (Booking Holdings and Expedia Group) are less aggressive in pricing than other OTAs.
- Metasearch engines record the highest lose rate, as they aggregate different offers from various distribution platforms with disparity at the source.
- OTAs apply more aggressive discounts for last-minute bookings.
- OTAs implement more aggressive pricing strategies for short stays, increasing disparity in this segment.
- Price disparity is higher when expected occupancy is greater.
More specifically, the study clearly shows that OTAs aim to maximize booking conversions, and to this end often apply aggressive discounts on last-minute bookings.
This could be due to:
- Conversion optimization: OTAs lower prices to attract customers seeking immediate availability.
- Use of wholesale rates or hidden discounts: Some OTAs apply unauthorized discounts on wholesale rates, creating disparity with the direct channel to capture last-minute bookings.
- Automated promotions: OTA algorithms detect unsold inventory and dynamically adjust prices to encourage quick bookings.
In this context, continuous price monitoring becomes a priority for hotels, and real-time strategy adjustments are the key to optimizing direct channel reservations.
1. Channel Typology
When analyzing the behavior of different types of intermediaries, we identify the following differences in their pricing strategies.
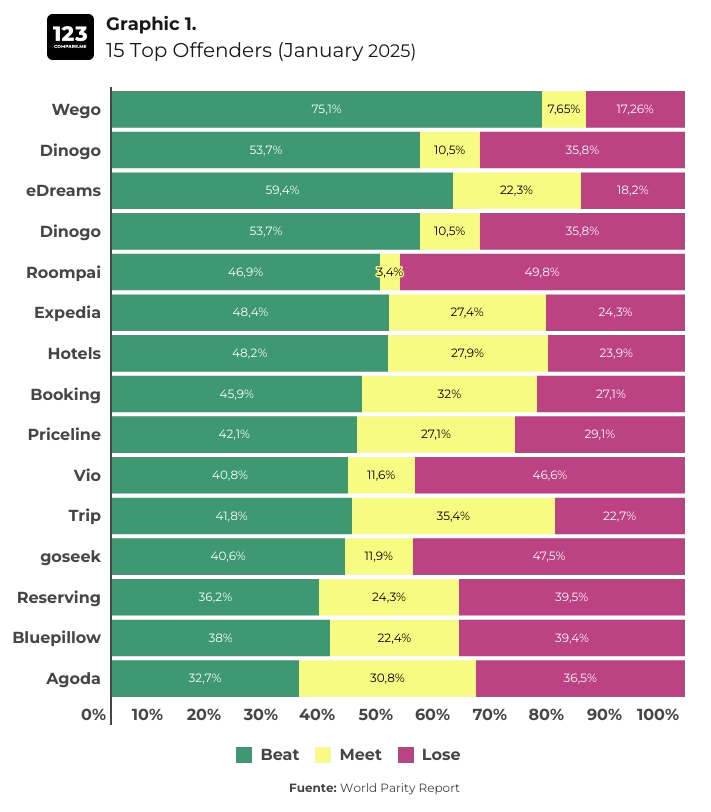
- Major OTAs (Booking Holdings and Expedia Group), implement less aggressive pricing strategies (see Graph 1).
Within Booking Holdings, Priceline and Agoda show the highest lose rate percentages.
- Other OTAs, such as Roompai, Vio, and Reserving, are significantly more aggressive in pricing, suggesting the use of wholesale rates or customer acquisition strategies through discounts.
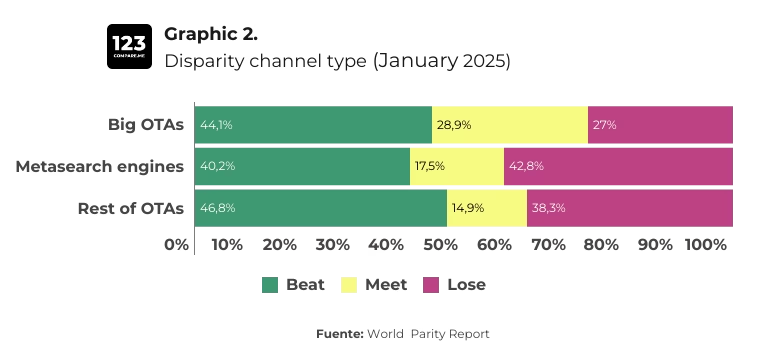
- Metasearch engines register the highest lose rate, with an average exceeding 40%, compared to 27% for major OTAs and 38.3% for other OTAs (see Graph 2).
2. Relationship Be Channel Typology tween Disparity, Booking Anticipation, and Length of Stay
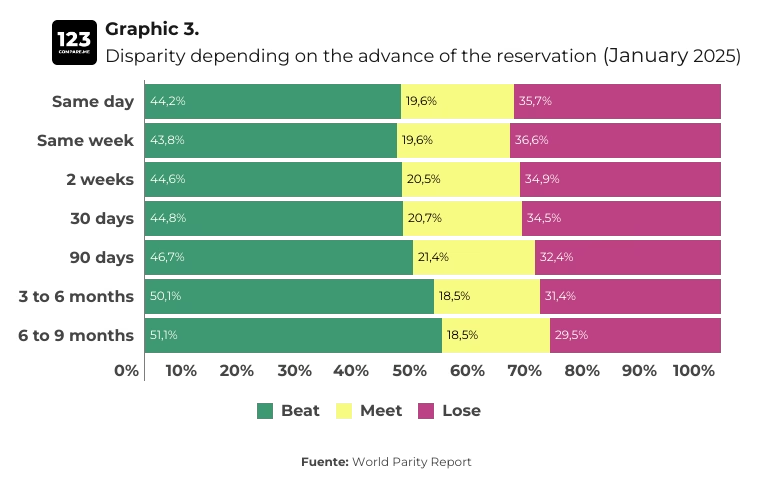
The January study further confirms the trend observed in previous months: price disparity tends to increase when booking anticipation is lower and stays are shorter.
- In this regard, last-minute bookings (same day or same week) show a higher lose rate, as noted at the beginning of the report.
- As booking anticipation increases, the lose rate decreases, suggesting that hotels have greater control over their rates for long-term reservations (see Graph 3).
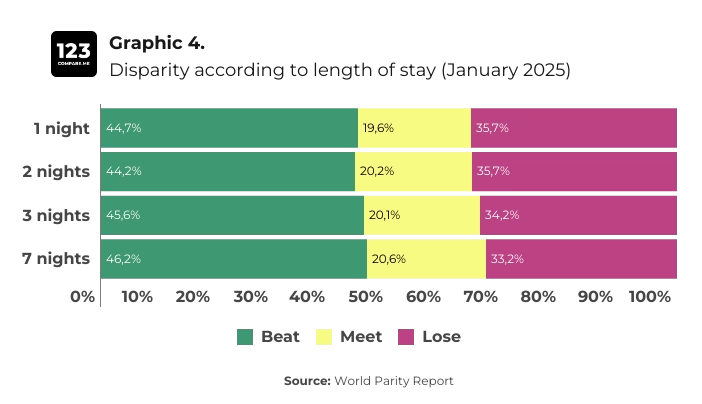
- Regarding the length of stay, shorter stays (1-2 nights) have a higher lose rate, whereas longer stays (7 nights) show lower price disparity (see Graph 4).
3. Relationship Between Expected Occupancy and Price Disparity
Lastly, the analysis based on expected occupancy reveals the following insights:
- Higher expected occupancy: OTAs offer more aggressive pricing during these periods, with a lose rate of 37.6%.
- Lower expected occupancy::The lose rate decreases to 30.2%.
About the WPM
The World Parity Monitor (WPM) provides a detailed view of the evolution of price parity in 3-, 4-, and 5-star hotels across the 60 most important tourist destinations worldwide.
The study is based on the analysis of over 6 million monthly searches on Google Hotels, allowing for an evaluation of price differences between hotels’ direct rates and those offered by OTAs.
Methodology: Key Performance Indicators (KPIs)
- Beat: The hotel’s direct price is lower than OTA prices.
- Meet: The hotel’s direct price and OTA prices are similar (+/- 0.5%).
- Lose: OTA prices are lower than the hotel’s direct price.