
As every month, 123Compare.me publishes the results of the World Parity Monitor; a monthly tracker analyzing the evolution of price parity in the global hotel sector.
The March edition focuses specifically on how price behavior varies depending on booking anticipation, taking into account the establishment category, type (independent hotels and large hotel groups), and destination.
Highlights
- The direct channel offers better prices, though differences are slight; therefore, hotels must continue focusing on visibility and added value.
- Globally, an arch-shaped trend emerges: early bookings come with lower prices, which rise and peak around two weeks before check-in.
- Five-star hotels show greater price stability compared to lower categories, like 3- and 4- star establishments.
- Independent hotels adopt more variable pricing policy, while large hotel groups maintain more consistent pricing across lead times.
- Price curves vary significantly by destination, so revenue strategies should be tailored to the specific profile of each market.
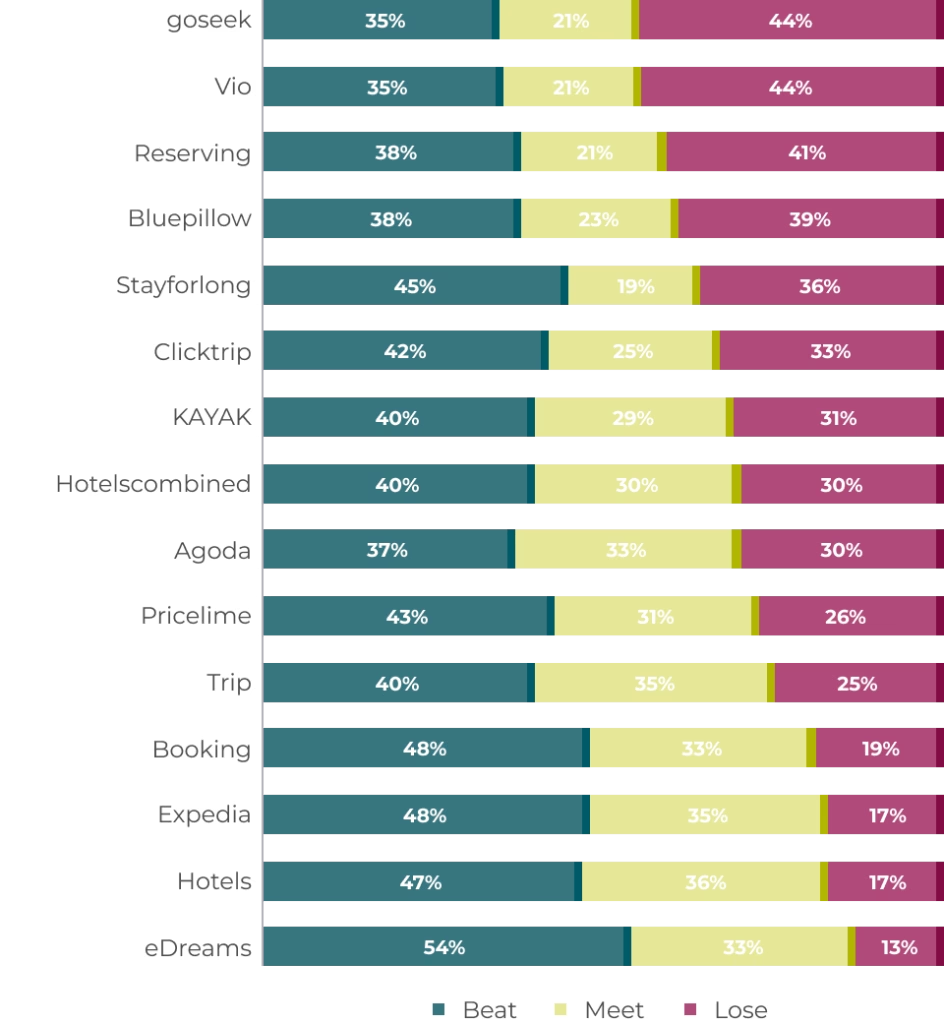
1. Average BML | OTAs | Lead Time
Overall, the March BML shows stability compared to previous months, as shown in Graph 1:
Graph 1. Beat, Meet, and Lose | Media | March 2025

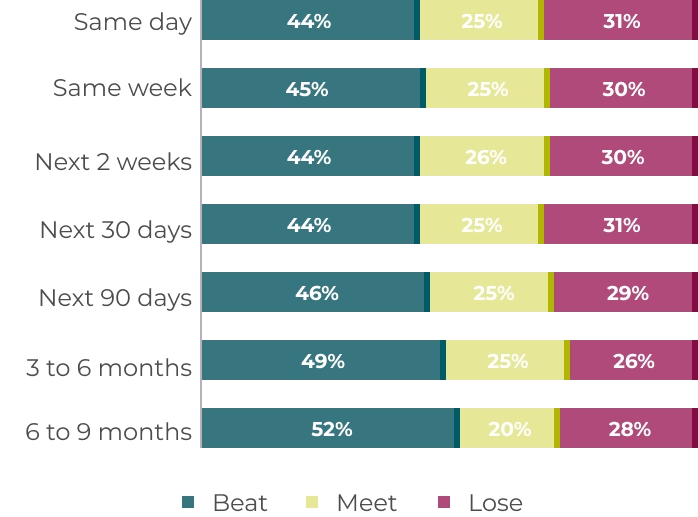
Regarding the pricing policy adopted by OTAs, it is observed that the large groups, Booking and Expedia, maintain less aggressive pricing strategies compared to other online intermediaries (see Graph 2).
Additionally, the downward trend in the “Lose Rate” of the Expedia Group, observed in February, continues to consolidate.
Graph 2. OTAs and Metasearch Engines with More Aggressive Pricing Policies | BML | March 2025
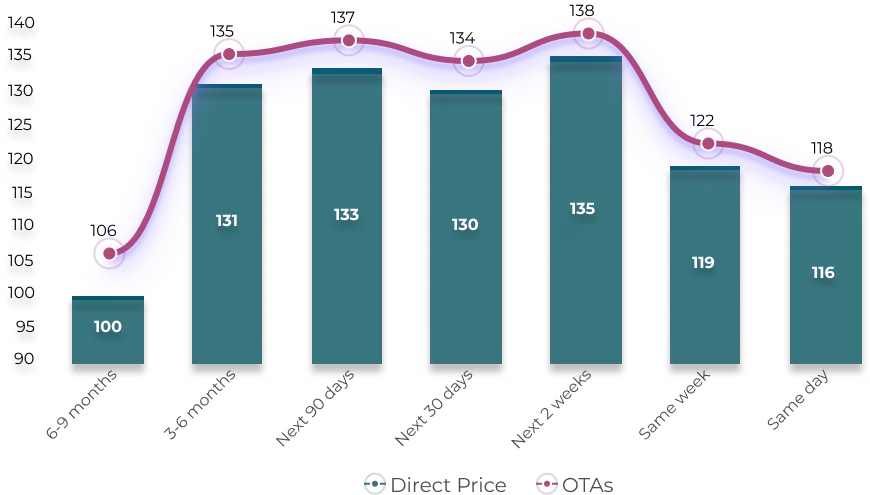
Regarding reservation anticipation, it continues to be observed that the lower the anticipation, the higher the “Lose Rate” (see Graph 3).
Graph 3. Disparity Based on Lead Time | BML | March 2025
2. General Price Behavior
For the study of general price behavior, we analyzed the average monthly prices for different check-in dates in the first quarter of this year:
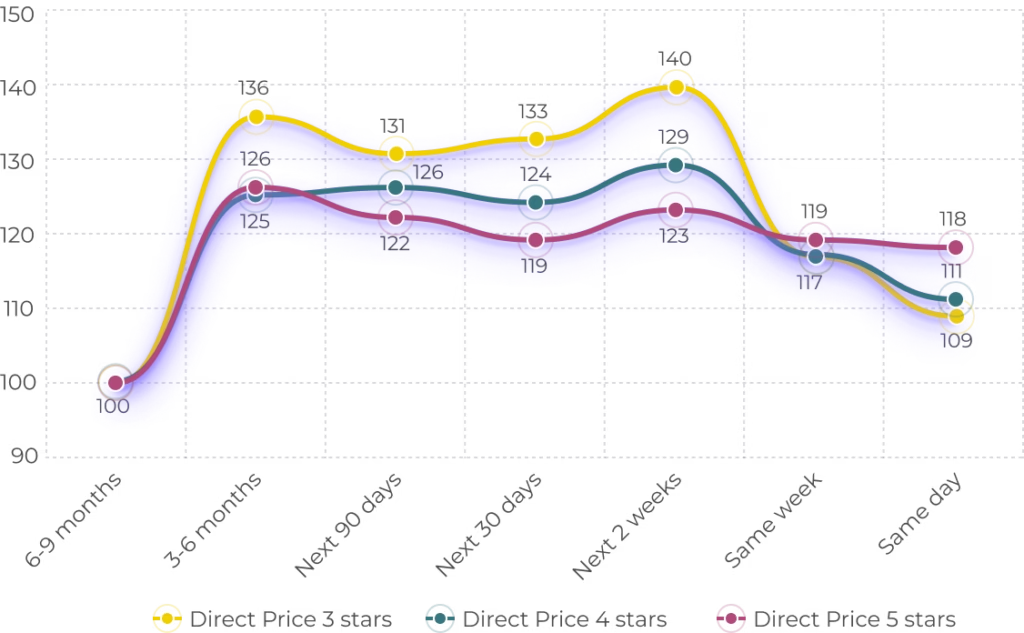
2.1. Price Curve Based on Lead Time
- Prices progressively increase from 6–9 months in advance until reaching their peak two weeks before the check-in date.
- Subsequently, prices drop in periods with shorter anticipation: the same week and the same day.
- This pattern suggests a revenue optimization strategy based on demand forecasting and availability.
- This behavior is observed in both the direct channel and OTAs.
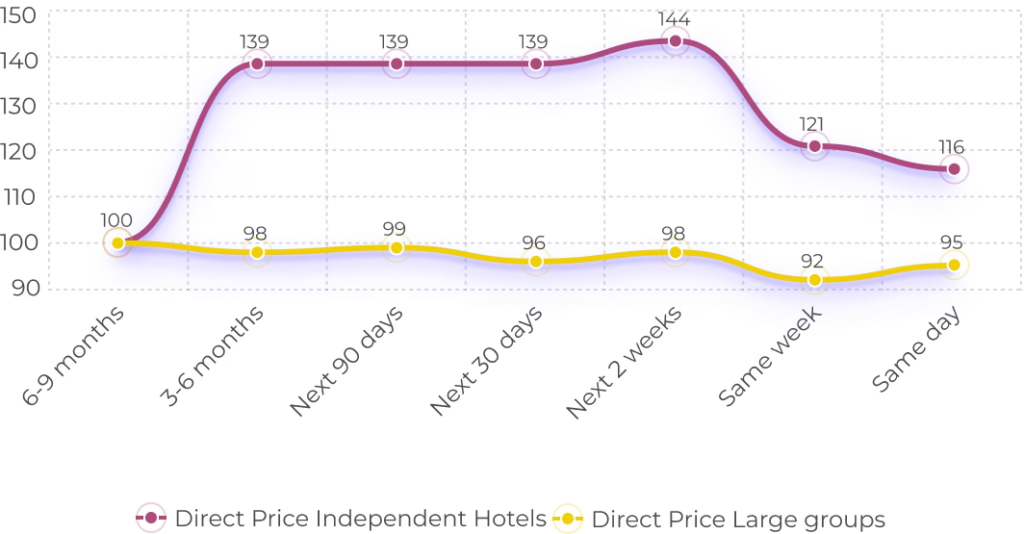
2.2. Price Comparison: Direct Channel vs OTAs
Although in all analyzed anticipation ranges the direct channel offers lower prices than OTAs, the “aggressiveness” of OTAs pricing increases as anticipation decreases (see Graph 4).
Graph 4. Price Differences Between the Direct Channel and OTAs (euros)
Base 100 = Direct Price 6 to 9 Months in Advance | Q1 2025
3. Analysis of Price Behavior by Hotel Category
- Three-star hotels exhibit a price structure with higher variability: the lowest prices are concentrated in bookings with greater anticipation, and the highest prices occur within the two to four weeks range before check-in. The curve shows some fluctuations as anticipation shortens, with moderate final drops.
- For four-star hotels, have a more pronounced price curve. The lowest direct price occurs between 6 and 9 months in advance, while the peak is reached within the two to four weeks range before check-in.
- Five-star hotels, on the other hand, show a much flatter price curve. While they also offer lower prices with greater anticipation, the differences between lead times are smaller, and the direct price range barely varies (see Graph 5).
Graph 5. Prices Based on lead Time and Hotel Category (euros)
Base 100 = Direct Price 6 to 9 Months in Advance | Q1 2025
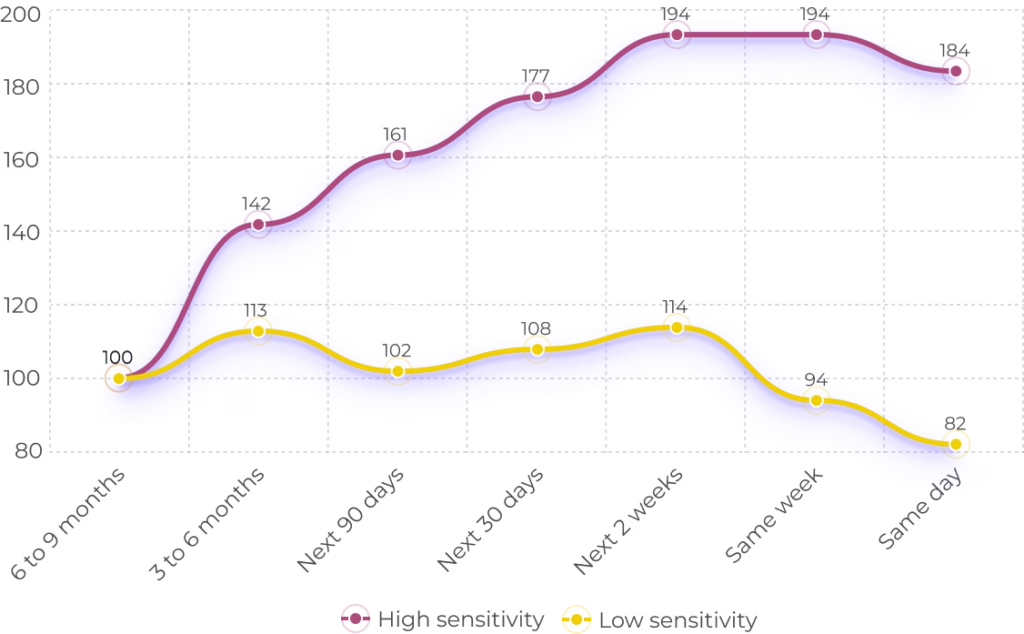
4. Price Behavior: Independent Hotels vs Large Hotel Groups
Independent hotels show greater price dispersion across all anticipation ranges. In contrast, large hotel groups maintain more homogeneous prices (see Graph 6).
Graph 6. Prices Based on Anticipation and Hotel Type: Independent Hotels vs Large Hotel Groups (euros)
Base 100 = Direct Price 6 to 9 Months in Advance | Q1 2025
5. Sensitivity to Anticipation by Destination
5.1. Destinations with High Sensitivity to Anticipation
- These Destinations offer more aggressive pricing for early bookings, applying early booking strategies.
- Prices increase progressively as the check-in date approaches.
- They are typically international tourist destinations with high seasonality, competitive markets, or a strong presence of tour operators, such as Phuket, London, Stockholm, Punta Cana, and Rio de Janeiro.
5.2. Destinations with Low Sensitivity to Anticipation
These are usually international cities with a strong corporate or institutional base, such as Paris, Shanghai, Beijing, Zurich, and Edinburgh, In these markets:
- Demand is continuous.
- Elasticity is low, and late bookings do not result in revenue loss but can allow for price increases (see Graph 7).
Graph 7. Price Behavior Based on Destination Sensitivity to Anticipation
Base 100 = Direct Price 6 to 9 Months in Advance | Q1 2025
What do revenue management experts think?
Sonia Molina, Business Unit Director at HotelsDot, highlights the value of the report’s findings and emphasizes the importance of incorporating new variables into price analysis, such as booking lead time, which she considers a key lever for optimizing revenue.
Among the five core variables that shape an effective Revenue Management strategy—volume, price, customer/channel, lead time, and booking conditions—lead time stands out for its ability to pinpoint the exact moment when demand is willing to pay more.
In practice, hotel demand behaves like a bell-shaped Gaussian curve. Identifying the peak of that curve—based on location, season, property type, etc.—enables revenue managers to maximize sales volume during the most profitable window.
This requires constant monitoring of demand trends and careful inventory planning, especially in highly seasonal or competitive markets.
About WPM
The World Parity Monitor is an open-access study by 123compare.me. It complements our price parity management and direct channel conversion service for hotels.
The World Parity Monitor provides insights into price parity trends in 3, 4, and 5-star hotels. It covers the 60 most important tourist destinations worldwide.
The study analyzes 5 million monthly comparisons in Google Hotels. It uses a consistent sample of more than 6,000 hotels. This allows an evaluation of price differences between hotels’ direct rates and those offered by OTAs.
The analysis considered a representative sample for different occupancies, lengths of stay, and booking lead times. Each first month of the quarter, an additional analysis examines country of origin, mobile device usage, and occupancy with children. Month-to-month temporal analyses are performed using comparable metrics.
Methodology: Key Performance Indicators (KPIs)
- Beat: The hotel’s direct price is lower than on OTAs.
- Meet: The hotel’s direct price and OTA prices are similar (+/- 0,5%).
- Lose: The OTA price is lower than the hotel’s direct price.